
Tue
Jul 30, 2024
NBL1 NATIONAL RANKINGS REVEALED
NBL1.com.au

The Mitsubishi Motors NBL1 National Finals will adopt a new, exciting format this year, with the introduction of the national rankings.
Share on Social
Related Tags
For the first time, teams from all five conferences – NBL1 North, NBL1 East, NBL1 South, NBL1 West and NBL1 Central – will be ranked amongst each other to determine the seedings and the day one schedule for the National Finals.
Teams have been ranked based on their regular season performances, using a formula that considers several factors.
The formula takes into consideration the number of games with a season, the number of NBL/WNBL players and imports within each conference as a percentage of total active players. A team’s win/loss percentage is multiplied by the conference weighting, giving every team national ranking points.
To calculate the formula the following points were allocated:
- NBL/WNBL Players (20+ Minutes) – 4 points
- NBL/WNBL Players (10-20 Minutes) – 3 points
- NBL/WNBL Players (<10 Minutes) – 1 point
- Imports – 2 points
Formula:
Regular Season WIN % x Conference Weighting = National Ranking Points
The format of the National Finals has also been modified, with the three winners from day one, plus the highest ranked loser, progressing to the Semi Finals. The winners of the Semi Finals will then go head-to-head for the ultimate Championship.
“This brand-new National Finals format is sure to increase the excitement, competitiveness and level of the tournament,” NBL1 General Manager Dean Anglin said.
“We consulted players and coaches around how we can elevate the National Finals and have landed on a solution that we feel will optimise player performance.
“With all five conferences now in their respective Finals, we are looking forward to what promises to be an incredible few weeks of basketball as teams look to punch their ticket to the National Finals.”
The 2024 NBL1 National Finals will take place at the Sunshine Coast from August 16-18. Click here for more information.
The NBL1 Conference Finals and National Finals will be streaming live and free via NBL1.com.au, NBL1 App and Kayo Freebies.

The National Rankings are based on the regular-season results of the women's and men's teams who qualified for their respective conference finals.*
*While the Bendigo Braves missed the conference finals, they automatically qualified for the National Rankings as the defending champions of the National Finals.
SEE THE 2024 FULL NATIONAL RANKINGS BELOW
Men’s National Rankings
|
TEAM |
CONFERENCE |
PLAYED |
WINS |
WIN % |
WEIGHTING |
RESULT |
RANKING |
|
Mackay |
North |
17 |
15 |
0.882 |
131.13% |
115.705 |
1 |
|
Geraldton |
West |
22 |
20 |
0.909 |
125.35% |
113.951 |
2 |
|
Mt Gambier |
South |
22 |
17 |
0.773 |
140.94% |
108.912 |
3 |
|
South Adelaide |
Central |
18 |
15 |
0.833 |
128.32% |
106.936 |
4 |
|
Sturt |
Central |
18 |
15 |
0.833 |
128.32% |
106.936 |
5 |
|
Canberra |
East |
20 |
18 |
0.900 |
118.41% |
106.567 |
6 |
|
Maitland |
East |
20 |
17 |
0.850 |
118.41% |
100.647 |
7 |
|
Darwin |
North |
17 |
13 |
0.765 |
131.13% |
100.277 |
8 |
|
Logan |
North |
17 |
13 |
0.765 |
131.13% |
100.277 |
9 |
|
Forestville |
Central |
18 |
14 |
0.778 |
128.32% |
99.807 |
10 |
|
Frankston |
South |
22 |
15 |
0.682 |
140.94% |
96.099 |
11 |
|
Ballarat |
South |
22 |
15 |
0.682 |
140.94% |
96.099 |
12 |
|
Sandringham |
South |
22 |
15 |
0.682 |
140.94% |
96.099 |
13 |
|
Joondalup |
West |
22 |
16 |
0.727 |
125.35% |
91.160 |
14 |
|
Eltham |
South |
22 |
14 |
0.636 |
140.94% |
89.692 |
15 |
|
Manly Warringah |
East |
20 |
15 |
0.750 |
118.41% |
88.806 |
16 |
|
Willetton |
West |
22 |
15 |
0.682 |
125.35% |
85.463 |
17 |
|
Brisbane |
North |
17 |
11 |
0.647 |
131.13% |
84.850 |
18 |
|
Dandenong |
South |
22 |
13 |
0.591 |
140.94% |
83.286 |
19 |
|
Knox |
South |
22 |
13 |
0.591 |
140.94% |
83.286 |
20 |
|
BA CoE |
East |
20 |
14 |
0.700 |
118.41% |
82.886 |
21 |
|
West Adelaide |
Central |
18 |
11 |
0.611 |
128.32% |
78.420 |
22 |
|
Albury Wodonga |
East |
20 |
13 |
0.650 |
118.41% |
76.965 |
23 |
|
Inner West |
East |
20 |
13 |
0.650 |
118.41% |
76.965 |
24 |
|
Geelong |
South |
22 |
12 |
0.545 |
140.94% |
76.879 |
25 |
|
Mandurah |
West |
22 |
13 |
0.591 |
125.35% |
74.068 |
26 |
|
Goldfields |
West |
22 |
13 |
0.591 |
125.35% |
74.068 |
27 |
|
East Perth |
West |
22 |
13 |
0.591 |
125.35% |
74.068 |
28 |
|
Rockingham |
West |
22 |
13 |
0.591 |
125.35% |
74.068 |
29 |
|
Sydney |
East |
20 |
12 |
0.600 |
118.41% |
71.045 |
30 |
|
Rockhampton |
North |
17 |
9 |
0.529 |
131.13% |
69.423 |
31 |
|
Southern Districts |
North |
17 |
9 |
0.529 |
131.13% |
69.423 |
32 |
|
Bankstown |
East |
20 |
11 |
0.550 |
118.41% |
65.124 |
33 |
|
Central Districts |
Central |
18 |
9 |
0.500 |
128.32% |
64.162 |
34 |
|
Warwick |
West |
22 |
11 |
0.500 |
125.35% |
62.673 |
35 |
Women’s National Rankings
|
TEAM |
CONFERENCE |
PLAYED |
WINS |
WIN % |
WEIGHTING |
RESULT |
RANKING |
|
Knox |
South |
22 |
20 |
91% |
149.24% |
135.675 |
1 |
|
Keilor |
South |
22 |
19 |
86% |
149.24% |
128.891 |
2 |
|
Northside |
North |
17 |
16 |
94% |
132.49% |
124.694 |
3 |
|
Albury Wodonga |
East |
20 |
20 |
100% |
122.41% |
122.407 |
4 |
|
Rockingham |
West |
19 |
17 |
89% |
126.85% |
113.499 |
5 |
|
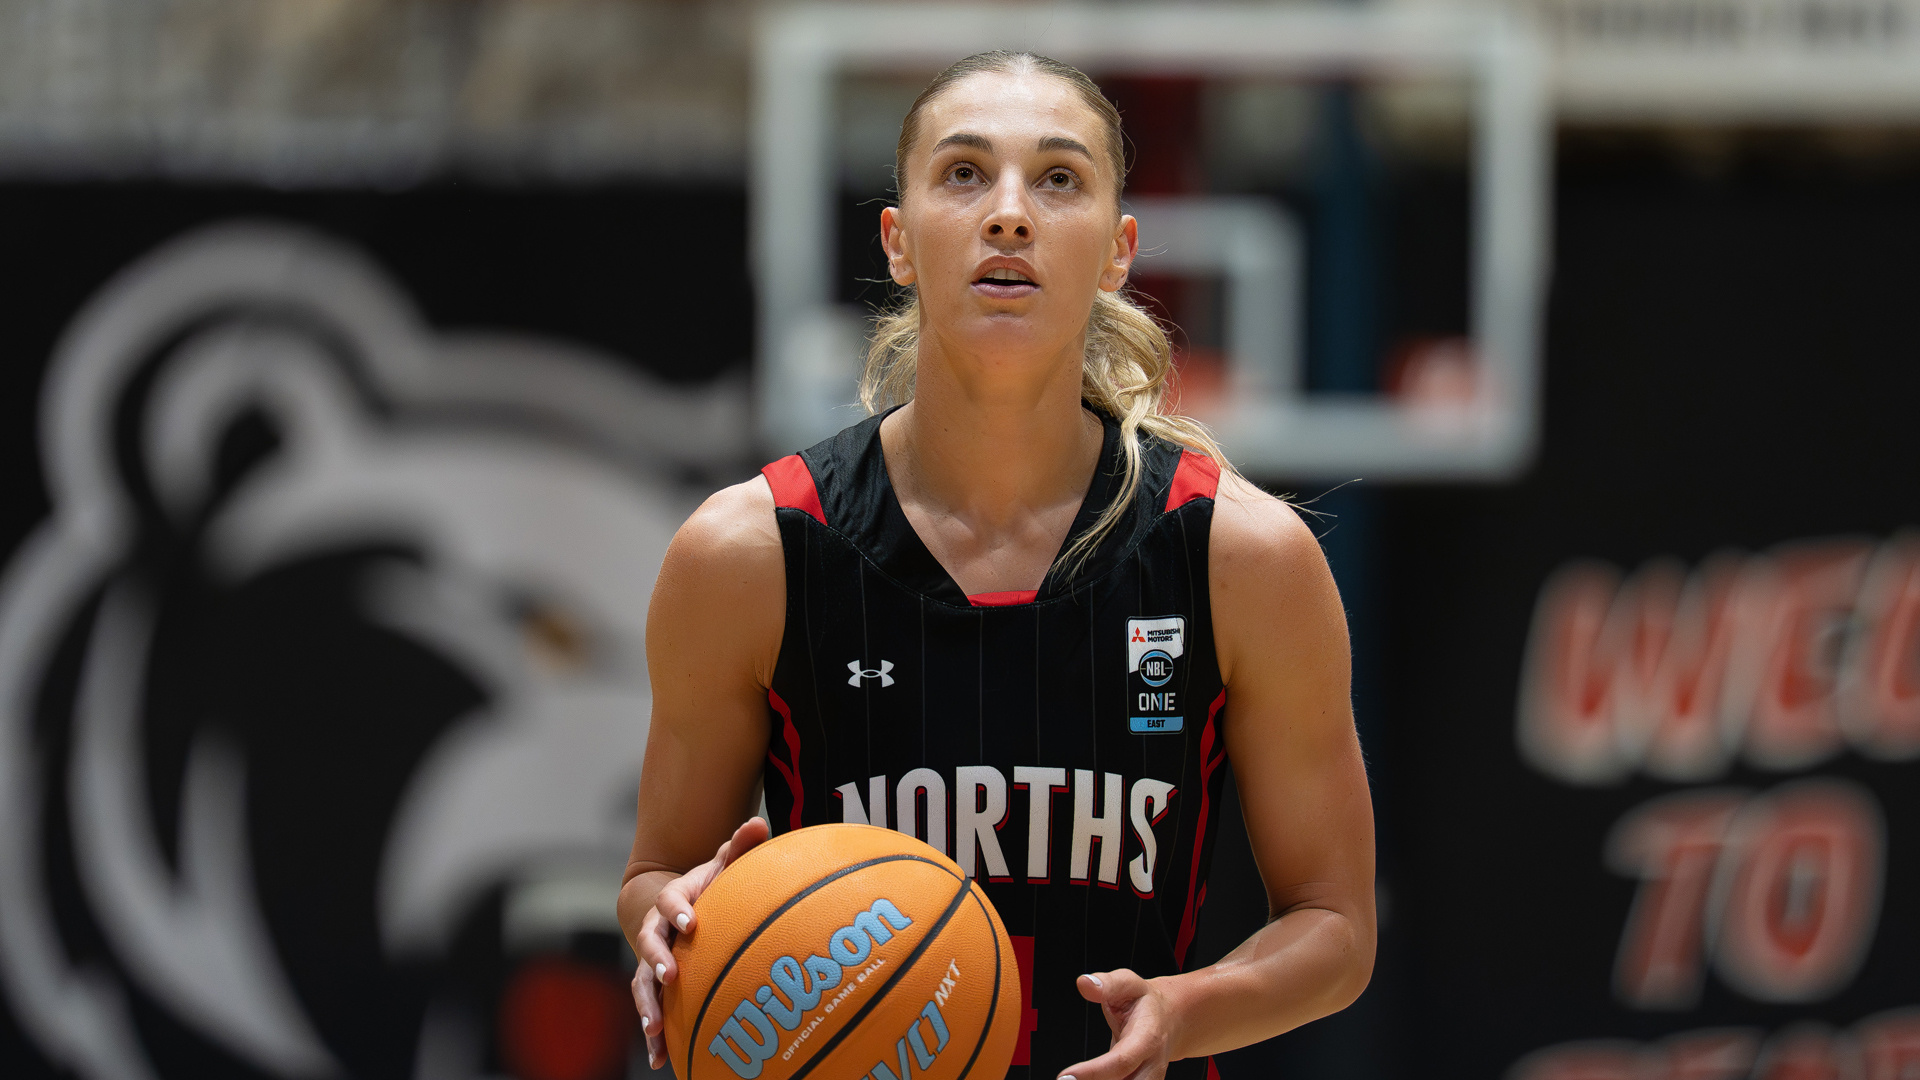
Norths Bears |
East |
20 |
18 |
90% |
122.41% |
110.166 |
6 |
|
Rockhampton |
North |
17 |
14 |
82% |
132.49% |
109.107 |
7 |
|
Townsville |
North |
17 |
14 |
82% |
132.49% |
109.107 |
8 |
|
Dandenong |
South |
22 |
16 |
73% |
149.24% |
108.540 |
9 |
|
Warwick |
West |
19 |
16 |
84% |
126.85% |
106.823 |
10 |
|
Cockburn |
West |
19 |
15 |
79% |
126.85% |
100.146 |
11 |
|
Manly Warringah |
East |
20 |
16 |
80% |
122.41% |
97.925 |
12 |
|
Newcastle |
East |
20 |
16 |
80% |
122.41% |
97.925 |
13 |
|
Sturt |
Central |
18 |
14 |
78% |
125.82% |
97.863 |
14 |
|
Central Districts |
Central |
18 |
14 |
78% |
125.82% |
97.863 |
15 |
|
Mt Gambier |
South |
22 |
14 |
64% |
149.24% |
94.972 |
16 |
|
Ballarat |
South |
22 |
14 |
64% |
149.24% |
94.972 |
17 |
|
Sandringham |
South |
22 |
14 |
64% |
149.24% |
94.972 |
18 |
|
Southern Districts |
North |
17 |
12 |
71% |
132.49% |
93.520 |
19 |
|
North Gold Coast |
North |
17 |
12 |
71% |
132.49% |
93.520 |
20 |
|
Perry Lakes |
West |
19 |
14 |
74% |
126.85% |
93.470 |
21 |
|
Waverley |
South |
22 |
13 |
59% |
149.24% |
88.189 |
22 |
|
Forestville |
Central |
18 |
12 |
67% |
125.82% |
83.883 |
23 |
|
South Adelaide |
Central |
18 |
12 |
67% |
125.82% |
83.883 |
24 |
|
Eltham |
South |
22 |
12 |
55% |
149.24% |
81.405 |
25 |
|
Bendigo |
South |
22 |
12 |
55% |
149.24% |
81.405 |
26 |
|
SW Metro |
North |
17 |
10 |
59% |
132.49% |
77.934 |
27 |
|
North Adelaide |
Central |
18 |
11 |
61% |
125.82% |
76.893 |
28 |
|
Sutherland |
East |
20 |
12 |
60% |
122.41% |
73.444 |
29 |
|
Central Coast |
East |
20 |
12 |
60% |
122.41% |
73.444 |
30 |
|
Willetton |
West |
19 |
11 |
58% |
126.85% |
73.441 |
31 |
|
Perth |
West |
20 |
11 |
55% |
126.85% |
69.769 |
32 |
|
Lakeside |
West |
19 |
10 |
53% |
126.85% |
66.764 |
33 |
|
Sydney |
East |
20 |
10 |
50% |
122.41% |
61.203 |
34 |
|
Canberra |
East |
20 |
9 |
45% |
122.41% |
55.083 |
35 |
|
Joondalup |
West |
19 |
8 |
42% |
126.85% |
53.411 |
36 |
|
|
|


More News


Naming Rights

Major Partners

.avif)

.avif)